Every summer, our technical support team fields urgent calls from distributors in Spain, Italy, and southern France IEC 61215 standard 1. Their solar roof shingles 2 are underperforming. The culprit? Roof surface temperatures soaring past 70°C—far above the 25°C baseline on every datasheet.
To verify solar roof shingle temperature coefficients for high-temp European regions, you must cross-reference manufacturer datasheets with independent TUV/CE test reports, conduct on-site thermal imaging at peak summer conditions, and validate real power output against IEC 61215 standard measurements at multiple operating temperatures.
This guide walks you through the exact steps, test reports, and quality controls you need IEC 61730 safety qualification 3. Whether you are a roofing company sourcing from China or an architect specifying BIPV for a Mediterranean project, every section below gives you actionable methods to protect your energy yield and investment.
How can I verify that the temperature coefficient on the datasheet matches the actual performance of my shingles?
When we ship solar roof shingles to partners in Trapani or Barcelona, we always include full IV-curve test data 4 at multiple temperatures. But we also know that a datasheet alone is not enough for buyers who need bankable proof.
You can verify temperature coefficients by comparing datasheet values against independent lab IV-curve measurements at 25°C, 50°C, and 75°C, then cross-checking with on-site thermal imaging and power monitoring data during peak summer operation on your actual roof.

Understanding What the Datasheet Actually Tells You
A temperature coefficient 5 datasheet typically lists three key values:
| Parameter | Symbol | Typical Range (Shingles) | What It Measures |
|---|---|---|---|
| Voltage Temp Coefficient | β (Voc) | -0.33% to -0.36%/K | Voltage drop per degree above 25°C |
| Power Temp Coefficient | γ (Pmax) | -0.38% to -0.44%/K | Power output drop per degree above 25°C |
| Current Temp Coefficient | α (Isc) | +0.03% to +0.05%/K | Slight current increase with heat |
These values are measured under Standard Test Conditions (STC) 6: 1000 W/m² irradiance, 25°C cell temperature, and AM1.5 spectrum. The problem is that STC almost never occurs on a real rooftop in Southern Europe. Cell temperatures on a charcoal-black solar shingle in July in Rome can easily reach 65–75°C. That is 40–50K above the STC baseline.
Step-by-Step Verification Method
Step 1: Audit the datasheet. Check that the manufacturer lists all three coefficients (β, γ, α) with clear units (%/K or %/°C). If only one value is listed, ask why. Reputable producers like our team at Lonsontech provide the full set.
Step 2: Request independent lab IV curves. Ask for IV-curve data measured at a minimum of three temperatures—25°C, 50°C, and 75°C. The power drop between these points should match the γ coefficient on the datasheet within ±5% tolerance.
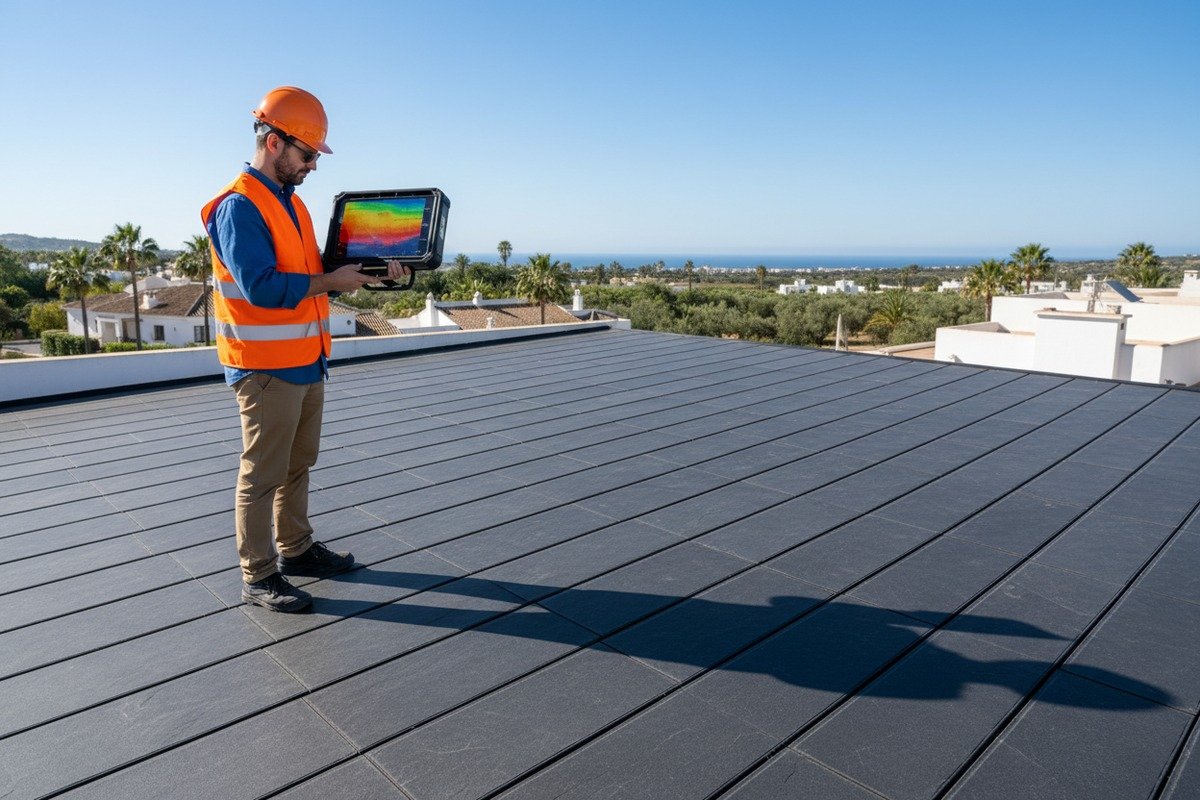
Step 3: Conduct on-site thermal imaging. Use an infrared camera (FLIR or similar) to measure the actual cell temperature of installed shingles during peak sun hours (11:00–14:00 local time) in summer. Record ambient temperature simultaneously.
Step 4: Measure real power output. Use a portable IV tracer or your inverter's monitoring data. Compare the measured Pmax at the recorded cell temperature against the predicted value using the datasheet coefficient.
Step 5: Calculate the effective coefficient. Use this simple formula:
γ_measured = (P_measured – P_STC) / (P_STC × (T_cell – 25))
If the result is significantly worse than the datasheet value (e.g., -0.52%/K instead of -0.38%/K), the product does not match its specification.
Why Dynamic Conditions Matter
Standard lab tests use steady-state conditions. Real rooftops experience rapid temperature swings of 40–50K within a single day. Our R&D team has observed that some cell technologies show non-linear behavior above 60°C—the coefficient itself can worsen slightly. This is why we recommend testing across at least three temperature points, not just two.
For projects in Mediterranean Csa climates 7 (Trapani, Barcelona, Athens), always budget for on-site verification during the first summer after installation. The cost of a thermal imaging 8 survey and portable IV tracer is minimal compared to the risk of a 10–15% annual yield shortfall.
What specific TUV or CE test reports should I request to confirm heat resistance for my Southern European projects?
Our CE and TUV certifications cover a wide range of electrical and mechanical tests, but not all buyers know which specific test clauses relate to heat performance. Over the years, we have learned exactly which reports matter most for Mediterranean deployments.
Request the full IEC 61215 thermal cycling report (200 cycles, -40°C to +85°C), the IEC 61215 damp-heat test report (1000 hours at 85°C/85% RH), and the IEC 61730 safety qualification report, plus any CPR fire classification documentation such as BROOF(t4) for European building compliance.

The Essential Test Reports Explained
Not all TUV or CE test reports are equal. Here is a breakdown of the specific reports you must request and why each one matters for high-temperature European regions:
| Test Standard | Key Test | Conditions | Why It Matters for Hot Climates |
|---|---|---|---|
| IEC 61215 Clause 10.11 | Thermal Cycling | 200 cycles, -40°C to +85°C | Simulates daily and seasonal temperature swings; reveals solder joint and encapsulant failures |
| IEC 61215 Clause 10.13 | Damp Heat | 1000h at 85°C / 85% RH | Tests long-term degradation under combined heat and humidity typical of coastal Mediterranean sites |
| IEC 61215 Clause 10.7 | Hot Spot Endurance | 5h at peak irradiance with shaded cells | Identifies cells that overheat dangerously when partially shaded by roof features |
| IEC 61730 | Safety Qualification | Includes dielectric, ground continuity, fire | Confirms the shingle remains safe at operating limits; required for CE marking |
| EN 13501-5 | External Fire (BROOF t4) | Burning brand on roof surface | Mandatory in most EU countries for roof-integrated products; tests fire spread resistance |
| IEC 62804 | PID Resistance | 96h at 85°C, 85% RH, system voltage | Potential Induced Degradation test; critical for string-connected shingle systems |
How to Read These Reports
When you receive a TUV test report, look for the following:
Test sample identification. The model number, production batch, and date must match what you are ordering. A common issue in OEM sourcing is receiving a test report for a different product variant.
Pass/fail criteria. For thermal cycling, the power degradation after 200 cycles must be less than 5%. For damp heat, the same 5% limit applies. If the report shows 4.8% degradation, the product passed—but barely. Ask about margin.
Visual inspection results. After thermal cycling, the report should note zero delamination, no bubbles, and no broken interconnects. These visual defects often appear before electrical degradation and are early warning signs.
Beyond Electrical Standards: Building Compliance
For European projects, CE marking for a solar shingle is not just about electrical performance. The Construction Products Regulation (CPR) 9 requires proof that the product performs as a building material. This means you need fire classification (typically BROOF t4 for Southern European countries), wind load resistance data (we test to Grade 15), and hail resistance certification (our shingles withstand 35mm hailstones at terminal velocity).
Our advice: create a compliance checklist before your first order. Send it to your supplier and ask them to match each line item with a specific test report page number. If they cannot do this, that is a red flag.
The 85°C Safety Threshold
The 85°C figure appears repeatedly in IEC standards for good reason. It is the upper limit of material stability for most encapsulants and backsheets used in PV modules. In Trapani and other Mediterranean south locations, peak roof membrane temperatures can reach 80°C. This leaves only a 5°C margin. If your shingle design has poor ventilation or sits flush against insulation, cell temperatures can breach this threshold. Always request evidence that the product has been tested at or near this limit.
How will the temperature coefficient impact the long-term energy yield and ROI of my solar roof installation?
When our engineering team helps distributors model project returns for Southern Europe, the temperature coefficient is always the single biggest variable after irradiance itself. Ignoring it leads to overpromised yields and disappointed end customers.
A solar roof shingle with a γ of -0.38%/K operating at 65°C average summer cell temperature loses approximately 15.2% of its rated power during peak hours, which compounds over 25 years to reduce cumulative energy yield by 10–15% compared to nameplate projections based on STC alone.

The Math Behind the Loss
Let us use a concrete example. Assume you install solar roof shingles rated at 84Wp per shingle in Rome. The average peak-hour cell temperature in July is 65°C—that is 40K above the 25°C STC baseline.
Power loss = γ × ΔT = -0.38%/K × 40K = -15.2%
So your 84Wp shingle delivers only about 71.2Wp during the hottest hours. That is nearly 13W lost per shingle. On a 100-shingle residential roof (8.4 kWp system), you lose 1.28 kW of peak capacity during the hours when solar irradiance is highest.
Comparing Cell Technologies
The choice of cell technology inside your solar shingle has a dramatic effect on long-term yield in hot climates.
| Cell Technology | Typical γ (Pmax) | Power Loss at 65°C Cell Temp | Relative Yield Over 25 Years (vs. STC) |
|---|---|---|---|
| Standard PERC | -0.38% to -0.40%/K | 15.2–16.0% | 85–87% of nameplate |
| Half-Cut PERC | -0.36% to -0.38%/K | 14.4–15.2% | 86–88% of nameplate |
| HJT (Heterojunction) | -0.24% to -0.26%/K | 9.6–10.4% | 90–92% of nameplate |
| TOPCon | -0.29% to -0.32%/K | 11.6–12.8% | 88–90% of nameplate |
HJT cells offer a clear advantage. Over 25 years in a Mediterranean climate, the 5–6% higher relative yield compared to standard PERC translates directly into thousands of euros in additional revenue or savings.
Compounding Effects on ROI
The temperature-related power loss does not occur in isolation. It compounds with other degradation factors:
- Annual degradation: Most warranties guarantee 80% output at year 25, meaning roughly 0.5–0.7% per year linear degradation.
- Soiling and shading: Dust and partial shading further reduce output by 2–5% annually in dry Mediterranean areas.
- Inverter clipping: If your system was designed based on STC power without accounting for temperature derating, the inverter may be oversized, reducing cost efficiency.
When we help partners build financial models, we always apply a temperature derating factor specific to the installation location. For Rome, we use 12–15%. For cooler northern European sites like Amsterdam, we use 5–7%. This honest approach protects the end customer's trust and the distributor's reputation.
Practical Mitigation Strategies
You can recover some of the temperature-related losses:
Ventilation gap. Ensure at least 40–60mm of airflow space between the shingle and the roof deck. Our mounting system is designed to maintain this gap. Studies show that proper ventilation can reduce cell temperatures by 5–10°C, recovering 2–4% of lost power.
Cool roof integration. Using high Solar Reflectance Index (SRI) materials on non-PV roof areas can reduce the overall roof surface temperature by 2.5–3.5°C, which slightly benefits adjacent shingles.
Select low-coefficient products. If your project is in a Csa climate zone, specify HJT or TOPCon cell technology. The upfront premium of 5–10% is typically recovered within 3–5 years through higher yield.
How do I ensure my Chinese manufacturer maintains consistent thermal stability across my bulk OEM orders?
Over the past 20 years, our production line has shipped millions of solar roof shingles. We have learned that consistency is harder than capability. Any factory can produce one excellent batch. The challenge is producing the thousandth batch with identical thermal performance.
To ensure consistent thermal stability across bulk OEM orders from China, implement a quality protocol that includes pre-shipment IV testing at elevated temperatures, third-party inspection at the factory, contractual temperature coefficient tolerances with penalty clauses, and periodic re-certification against IEC 61215 standards.

Building a Robust Quality Protocol
The most effective buyers we work with treat quality as a system, not a one-time check. Here is the framework we recommend:
Pre-Production Controls
Before any bulk order begins, lock down these elements:
Bill of Materials (BOM) approval. The cell supplier, encapsulant brand, backsheet type, and glass specification must be fixed. Any change to the BOM can shift the temperature coefficient. For example, switching from EVA to POE encapsulant improves damp-heat resistance but can slightly alter optical properties.
Golden sample testing. Produce 5–10 pre-production samples and send them to an independent European lab (TUV Rheinland, Bureau Veritas, or PI Berlin) for IV-curve testing at 25°C, 50°C, and 75°C. These become your reference standard.
In-Production Controls
Inline IV testing. Every shingle should pass a flash test at STC. But for high-temp projects, request that the factory also test a statistical sample (e.g., 1 per 100 units or AQL 2.5) at an elevated temperature—ideally 50°C or 60°C using a heated flash tester.
Electroluminescence (EL) imaging. EL imaging reveals micro-cracks, inactive cell areas, and solder defects that worsen under thermal stress. We perform EL imaging on 100% of our production. Insist on this.
Third-party inspection. Hire an independent inspection company (SGS, Intertek, or a specialized PV inspection firm) to witness testing at the factory before shipment. They should verify that the tested samples come from the actual production batch, not a cherry-picked set.
Contractual Protections
Your purchase agreement should include:
| Contract Clause | Recommended Specification | Purpose |
|---|---|---|
| γ (Pmax) Tolerance | ≤ ±0.02%/K from datasheet value | Prevents hidden degradation from cheaper cells |
| Flash Test Pass Rate | ≥ 98% within ±3% of rated Pmax at STC | Ensures consistent electrical output |
| EL Defect Rate | ≤ 1% with Grade C or worse defects | Catches micro-cracks before shipping |
| Re-certification Frequency | Every 12 months or per 500,000 units | Confirms ongoing compliance as materials evolve |
| Warranty Penalty | Pro-rata replacement if field γ exceeds datasheet by >10% | Financial incentive for the manufacturer to maintain quality |
Managing Batch-to-Batch Color and Performance Consistency
One pain point we hear constantly from European partners is batch color variation. When shingles sit side by side on a roof, even a slight difference in glass coating or cell color is visible. But what many buyers do not realize is that color variation often correlates with process variation—which can also affect thermal performance.
Our approach is to sort cells by both electrical performance and color bin before lamination. This adds a small cost but eliminates the patchwork appearance and ensures that every shingle in a shipment has nearly identical thermal characteristics.
Long-Term Supplier Relationship
The best protection against quality drift is a long-term partnership. Manufacturers who expect repeat orders invest more in consistency. We offer annual factory audits, shared production dashboards, and dedicated account engineers for our key European partners. When your supplier knows you are monitoring thermal performance data from fielded systems, they have every incentive to keep the production line tight.
If you are sourcing solar roof shingles for Southern European projects and want to discuss specific thermal verification requirements, our team is available at [email protected]. We provide full transparency on test data, and we welcome third-party factory inspections at any time.
Conclusion
Verifying temperature coefficients is not optional for solar roof shingle projects in high-temp European regions. Request independent test reports, conduct on-site thermal verification, specify low-coefficient cell technology, and enforce contractual quality controls with your manufacturer to protect long-term energy yield and ROI.
Footnotes
1. Details the international standard for PV module design qualification and reliability. ↩︎
2. Replaced with an authoritative .gov source discussing building-integrated photovoltaics, which includes solar roof shingles. ↩︎
3. Provides official information on the safety qualification standard for PV modules. ↩︎
4. Explains the diagnostic method of IV curve testing for solar panels. ↩︎
5. Defines and explains the temperature coefficient for PV modules. ↩︎
6. Defines the standardized conditions for PV module performance measurement. ↩︎
7. Describes the characteristics of Mediterranean Csa climates. ↩︎
8. Explains how thermal imaging is used for inspecting solar panels. ↩︎
9. Provides the official European Union regulation text for construction products. ↩︎
10. Replaced with Wikipedia, a generally authoritative source providing a comprehensive explanation of HJT cell technology. ↩︎