Every year, our production team reviews thousands of EL test images 1 before any solar roof shingle leaves the factory. The one fear that keeps our quality engineers up at night? Micro-cracks that slip through undetected — invisible to the naked eye but devastating to long-term performance. If you’re sourcing BIPV shingles for the European market, understanding how to read EL results is not optional. It’s the single most important skill that separates a profitable project from a costly warranty nightmare.
To evaluate EL test results and micro-cracks for solar roof shingle quality, you need to analyze electroluminescence images for uniform brightness, dark spots, and crack patterns, then classify micro-crack severity based on cell isolation risk and power loss potential, while verifying testing aligns with IEC standards and your warranty terms.
This guide walks you through the full evaluation process — from reading your first EL image to demanding the right documentation from your supplier. Let’s break it down step by step.
How do I interpret EL test images to identify hidden defects in my solar roof shingles?
When our engineers first train new quality inspectors, they always start with the same lesson: an EL image is like an X-ray of a solar cell's soul. If you can't read it, you're flying blind.
To interpret EL test images, look for uniform brightness across all cells — dark spots indicate micro-cracks, inactive areas, or broken fingers, while dark lines suggest mechanical stress fractures. Bright uniformity means healthy cells; any dark anomaly requires further classification and severity assessment.

What Is EL Testing and How Does It Work?
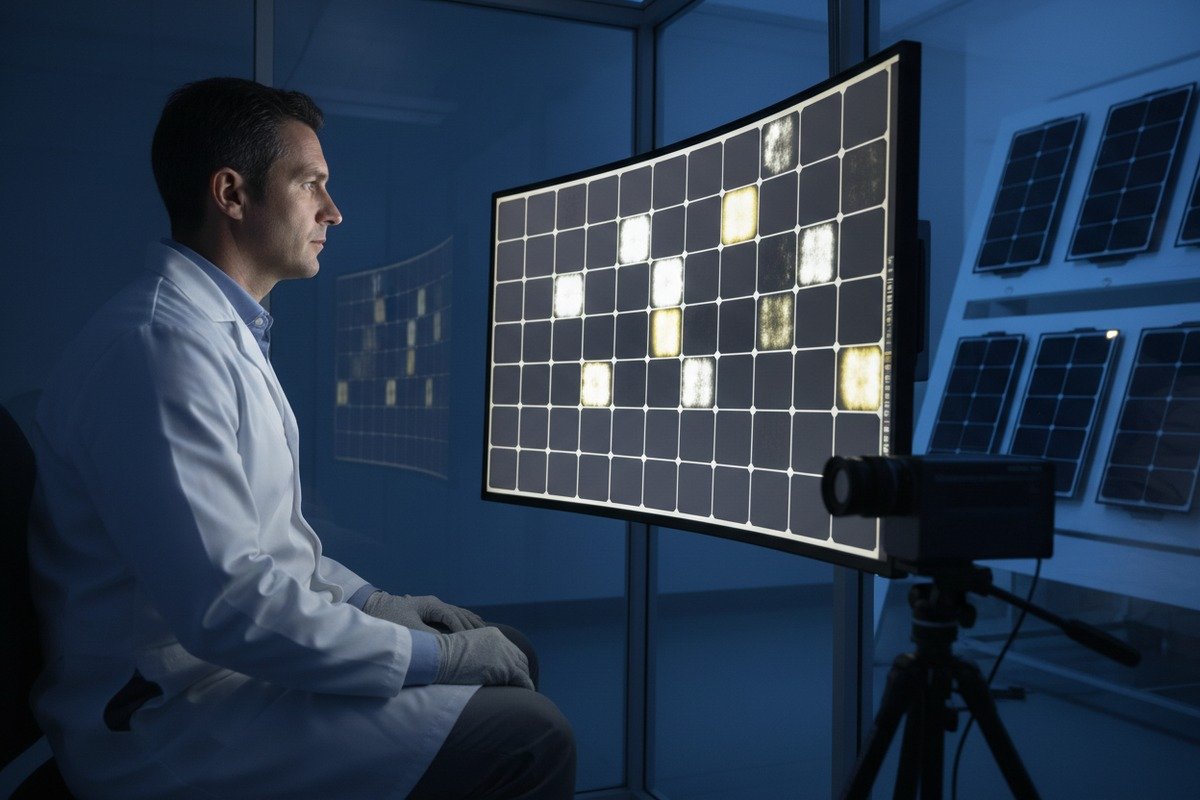
EL testing is a non-destructive imaging method. A controlled forward-bias current 2 passes through the solar cells. This causes the silicon to emit infrared light. A sensitive SWIR (Short-Wave Infrared) camera 3 captures that light. Healthy cells glow bright and even. Damaged cells appear dark.
For solar roof shingle 4s, this process is especially critical. Unlike standard panels on a rack, shingles are integrated into your roof. Replacing a defective shingle means exposing the roof structure. The stakes are higher. The cost of failure is greater.
Reading the Image: What to Look For
Here is a practical breakdown of what different EL image patterns mean:
| EL Image Pattern | What It Indicates | Severity Level |
|---|---|---|
| Uniform bright glow | Healthy cell, no defects | None |
| Small dark spots | Localized micro-cracks or shunts | Low to Medium |
| Dark lines across cell | Mechanical stress cracks | Medium to High |
| Entire dark cell | Electrically isolated or dead cell | Critical |
| Dark edges or corners | Finger interruptions or solder defects | Medium |
| Patchy brightness variation | Potential Induced Degradation (PID) | High |
Resolution Matters
Not all EL tests are equal. Our experience shipping to European distributors taught us this the hard way. High-resolution EL imaging detects approximately 84% of micro-cracks, while conventional resolution catches only about 67%. That 17% gap can mean the difference between a clean installation and a warranty claim two years later.
Common Mistakes When Reading EL Images
Many buyers glance at an EL report and see "mostly bright" cells. They assume everything is fine. But here's the catch: a single dark line in a critical interconnection zone 5 can cascade into a hot spot under load. Always zoom in. Always check cell borders. Always compare pre-shipment images against the manufacturer's baseline.
Also, EL testing alone is not enough. It excels at catching cracks and electrical defects, but it won't reveal delamination or encapsulant yellowing. Combine EL with visual inspection and, when possible, IV curve tracing for a complete picture.
Which types of micro-cracks should I consider as critical failures for my BIPV project?
Over the past 20 years of manufacturing solar roof tiles and shingles, our R&D team has catalogued hundreds of micro-crack patterns. Some are cosmetic. Others are project killers. Knowing the difference saves you money and reputation.
Critical micro-cracks for BIPV projects are those that electrically isolate cell segments, cross busbar connections, or create pathways for moisture ingress. Dendritic and multi-directional cracks under busbars pose the highest risk, potentially causing up to 40% early efficiency loss and hot-spot formation.

Not All Cracks Are Equal
This is something many purchasing managers don't realize. A hairline crack running parallel to the busbar inside a single cell segment may never cause measurable power loss. But a crack that crosses a busbar — cutting off current flow to an entire cell section — is an immediate problem.
Here's a classification framework we use internally:
| Crack Type | Description | Risk Level | Likely Impact |
|---|---|---|---|
| Mode A (Hairline, parallel) | Thin crack within one cell segment, parallel to fingers | Low | <2% power loss, stable over time |
| Mode B (Diagonal, single segment) | Crack crossing fingers but contained within one segment | Medium | 2–5% power loss, may propagate |
| Mode C (Crossing busbar) | Crack that crosses a busbar, isolating cell area | High | 5–15% power loss, hot-spot risk |
| Mode D (Multi-directional / Dendritic) | Web-like cracks across multiple segments | Critical | 15–40% power loss, replacement needed |
| Mode E (Edge crack with chipping) | Crack originating from cell edge with visible material loss | Critical | Moisture ingress risk, structural failure |
Why BIPV Shingles Face Unique Risks
Standard solar panels sit on rigid mounting frames. Solar roof shingles flex with the roof deck. They absorb wind uplift. They experience thermal expansion 6 differently because they bond directly to roofing substrate. This means micro-cracks in shingles face more complex stress cycles than those in traditional panels.
In our wind tunnel tests — we simulate up to Grade 15 winds — we've seen Mode B cracks propagate to Mode C within 500 thermal cycles if the initial crack exceeds 15mm in length. For a European building expected to last 50+ years, this kind of progression is unacceptable.
The Moisture Factor
Here is the critical difference for BIPV. In a standard panel, a micro-crack primarily affects electrical performance. In a solar roof shingle, a severe crack can also compromise the waterproof barrier. Water intrusion through a cracked shingle cell can damage the roof substrate, insulation, and interior. In European markets, this triggers massive compensation claims. Our professional waterproof drainage design exists precisely to mitigate this risk, but the cell-level integrity must still hold.
When to Reject a Batch
If your EL report shows more than 2% of cells with Mode C or Mode D cracks, reject the batch. If any cell shows Mode E edge cracking, reject it outright. These are not negotiable thresholds. They directly affect your 25-year performance guarantee and your reputation with end clients.
Can I trust that micro-cracks won't compromise my 25-year performance warranty?
This is the question we hear most from European distributors and roofing companies. And honestly, it's the right question to ask. When our sales team sits across from a buyer like Thomas in France, the conversation always comes back to this: "What happens in year 15?"
You can trust a 25-year performance warranty only if it is backed by documented EL testing at manufacturing, pre-shipment, and post-installation stages, combined with clearly defined micro-crack severity thresholds, degradation rate guarantees, and a financially stable supplier with verifiable warranty fulfillment history.

The Warranty Is Only as Good as the Testing Behind It
A piece of paper saying "25-year warranty" means nothing if the manufacturer didn't test properly before shipping. Here's what a robust warranty framework looks like:
Stage 1: Manufacturing EL test. Every cell is imaged. Defective cells are sorted out before lamination. This is where 80% of micro-crack issues should be caught.
Stage 2: Post-lamination EL test. The lamination process itself can introduce cracks due to thermal and mechanical stress. A second EL scan after lamination catches these.
Stage 3: Pre-shipment EL test. Packaging and palletizing can cause damage. A final check before the container is sealed provides the last line of defense.
Stage 4: Post-installation EL test. This is increasingly common in Europe. An independent inspector scans the installed shingles to establish a baseline. Any cracks found at this stage can be attributed to shipping or installation handling.
What "25-Year" Really Means
Most warranties guarantee that the shingle will produce at least 80% of its rated power output at year 25. But here's where micro-cracks complicate things:
- A Mode A crack at installation might stay stable and never affect this threshold.
- A Mode B crack might degrade the cell by 0.2% per year — manageable within warranty limits.
- A Mode C crack can degrade by 1–2% per year, breaching the warranty threshold by year 12.
This is why classification matters. Without it, your warranty is just a guess.
The "After-Sales Disappearance" Problem
European buyers are right to worry about this. Many Chinese suppliers offer aggressive warranty terms to win contracts, then become unreachable when claims arise. We address this with a dedicated 24/7 after-sales team and DDP logistics that keep us accountable from factory to rooftop. But not every supplier does this.
Ask your supplier three questions:
- Can you provide serial EL test records for every batch?
- Do you have a European-based warranty claims process or partner?
- What is your financial track record over the past 10 years?
If they can't answer all three clearly, your 25-year warranty is at risk.
Predictive Degradation: The Future of Warranty Assurance
Combining EL test data with real-time operational monitoring is where the industry is heading. If you know a shingle has two Mode B cracks and you track its power output monthly, you can predict when — or if — it will breach warranty thresholds. This turns reactive warranty claims into proactive maintenance. Several of our European partners are already piloting this approach with IoT-enabled monitoring systems.
How do I verify that my supplier's EL testing process meets European quality standards?
When we first pursued CE and TUV certification 7 for our solar roof shingles, the testing protocols forced us to rebuild parts of our quality control line from scratch. That experience taught us exactly what European inspectors look for — and what shortcuts some manufacturers take.
To verify your supplier's EL testing meets European standards, request IEC 61215 and IEC 61730 compliance documentation, demand sample EL images with full traceability, confirm camera resolution specifications, and insist on third-party audit reports from accredited bodies like TUV, Bureau Veritas, or SGS.

The Standards You Need to Know
European quality compliance for solar products revolves around several key standards. Here's a quick reference:
| Standard | What It Covers | Relevance to EL Testing |
|---|---|---|
| IEC 61215 | Design qualification and type approval for crystalline silicon PV modules | Requires EL testing as part of visual and electrical inspection protocols |
| IEC 61730 | PV module safety qualification | Ensures EL testing detects safety-critical defects like hot spots and insulation failures |
| IEC TS 60904-13 | EL imaging measurement procedures | Defines how EL tests should be conducted: current levels, camera specs, image processing |
| EN 13501-1 | Fire classification for construction products (CPR) | Indirectly relevant; structural defects caught by EL can affect fire safety |
| CE Marking (EU DoP) | Declaration of Performance for construction products | Requires documented quality control, including EL, for BIPV as building material |
What to Ask Your Supplier
Don't just ask "Do you do EL testing?" Every manufacturer will say yes. Instead, ask these specific questions:
Camera specifications. What is the camera resolution? SWIR cameras with at least 1 megapixel are the minimum for meaningful cell-level analysis 8. Anything less produces blurry images that hide defects.
Current levels. At what forward-bias current is the EL test performed? Standard practice is short-circuit current (Isc) or 10% of Isc. Testing at too-low current can make cracks invisible.
Image storage and traceability. Are EL images stored with batch and serial number traceability? Can you receive the original image files, not just compressed PDFs?
Frequency. Is EL testing performed on 100% of units or on a sample basis? For solar roof shingles destined for European rooftops, 100% inspection is the standard we follow. Sampling-based EL is insufficient for BIPV.
Third-Party Verification
This is non-negotiable for serious European projects. Ask for audit reports from accredited bodies. TUV Rheinland and TUV SUD 9 are the gold standards in Europe for PV product certification. Bureau Veritas and SGS also provide reliable factory audits.
A good audit report will confirm:
- EL testing equipment calibration records
- Operator training documentation
- Defect classification criteria used
- Rejection rate statistics
- Corrective action procedures for failed batches
Red Flags to Watch For
If your supplier provides only "summary pass/fail" reports without individual EL images, that's a red flag. If they can't tell you the camera model they use, that's a red flag. If their rejection rate is suspiciously low (below 0.5% for crystalline silicon), question whether their severity thresholds are too lenient.
Our own rejection rate at the cell level runs between 1.5% and 3%, depending on the batch. That's normal for mid-to-high-end production. A supplier claiming near-zero defect rates is either using very lenient criteria or not testing thoroughly.
The Role of AI in Modern EL Analysis
As of 2025, AI-powered EL analysis using convolutional neural networks (CNNs) 10 is becoming standard in high-volume manufacturing. These systems classify crack patterns automatically, reducing human error and speeding up throughput. We've integrated AI-assisted analysis into our line, and it catches approximately 12% more subtle defects than manual inspection alone. When evaluating a supplier, ask whether they use AI-augmented analysis or rely solely on human inspectors. Both can work, but the combination is strongest.
Conclusion
Evaluating EL test results and micro-cracks is not just a technical exercise — it's the foundation of every reliable solar roof shingle project. Demand clear EL documentation, classify cracks by severity, verify standards compliance, and hold your supplier accountable. Your roof, your warranty, and your reputation depend on it.
Footnotes
1. Background on the physical phenomenon used for solar cell inspection. ↩︎
2. Authoritative source (Wikipedia) providing a detailed explanation of forward bias in the context of p-n junctions, which is relevant to solar cell operation. ↩︎
3. Technical details on the imaging technology required for electroluminescence detection. ↩︎
4. Definition and overview of solar shingles as a building-integrated photovoltaic product. ↩︎
5. Highly authoritative source (Fraunhofer ISE) directly addressing interconnection technologies and challenges, including thermomechanical stresses and microcracks in solar cells, which is highly relevant to the article’s context. ↩︎
6. Authoritative and comprehensive explanation of thermal expansion from Wikipedia, suitable as a general reference. ↩︎
7. Official certification body for solar product safety and performance standards. ↩︎
8. Scientific context for microscopic and electrical analysis of solar cells. ↩︎
9. Global certification body specializing in solar energy safety and performance standards. ↩︎
10. Authoritative definition of the AI architecture used in automated defect detection. ↩︎