Every year, our engineering team fields the same urgent question from distributors across France, Germany, and the UK: will these solar shingles actually work under gray skies?
To evaluate solar roof shingle low-light performance for overcast European regions, focus on monocrystalline PERC cell efficiency ratings between 19–23%, request certified low-irradiance test data at 200 W/m², check temperature coefficients, simulate annual yield using PVGIS for your specific location, and compare real-world field data from northern climate installations.
This guide walks you through every step. We will cover how to verify efficiency claims, which certifications to demand, what to expect during long winters, and how to calculate ROI for BIPV tiles in low-irradiance zones monocrystalline PERC cell efficiency 1. Let’s get into it.
How can I verify the low-light conversion efficiency of solar shingles before importing them?
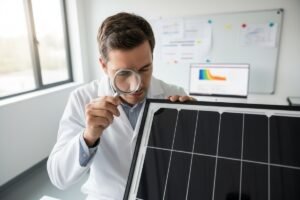
When we ship samples to new partners in northern Europe, the first conversation is always about real-world performance — not just the numbers on a glossy datasheet IEC 61215-compliant test reports 2.
You can verify low-light conversion efficiency by requesting IEC 61215-compliant test reports showing performance at 200 W/m² irradiance, comparing certified flash test data against independent lab results, and running site-specific yield simulations through the European Commission's PVGIS tool before placing any order.

Start with the Datasheet — But Don't Stop There
Every solar shingle datasheet lists a peak efficiency under Standard Test Conditions (STC) 3: 1000 W/m² irradiance, 25°C cell temperature, AM1.5 spectrum. That number matters, but it tells you nothing about a cloudy Tuesday in Hamburg IEC 61730 safety standard 4. What you need is the low-irradiance behavior curve.
Ask your supplier for performance data at 200 W/m² and 400 W/m². A good monocrystalline PERC shingle will retain 90–95% of its relative efficiency at 200 W/m². A cheap polycrystalline product might drop to 80% or lower. This single data point separates serious products from marketing hype.
Use PVGIS to Simulate Real Yield
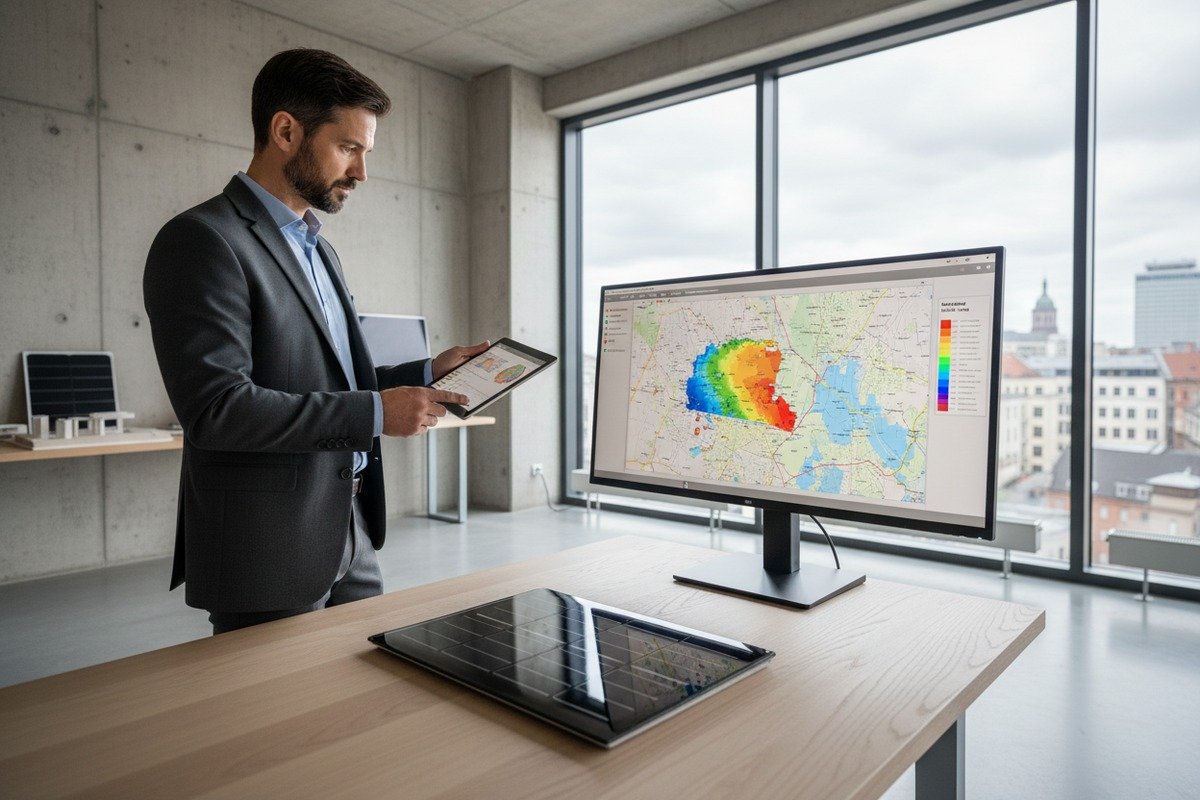
The European Commission offers a free tool called PVGIS 5 (Photovoltaic Geographical Information System). Plug in your project's postcode, roof pitch, orientation, and the shingle's rated power. PVGIS uses 10+ years of satellite weather data to estimate annual kWh output. We always run these simulations alongside our clients before they commit to large orders.
Compare Cell Technologies
| Cell Technology | Typical Efficiency | Low-Light Performance (200 W/m²) | Cost Level |
|---|---|---|---|
| Monocrystalline PERC | 19–23% | Retains 90–95% relative efficiency | Mid-to-High |
| Polycrystalline | 15–19% | Retains 80–88% relative efficiency | Low-to-Mid |
| Thin-Film (CdTe/CIGS) | 10–15% | Good diffuse light capture, but low absolute output | Low |
| N-type TOPCon/HJT | 21–24% | Retains 92–97% relative efficiency | High |
Monocrystalline PERC remains the sweet spot for European overcast regions. The rear passivation layer reflects unused photons back through the cell, boosting capture of diffuse light. N-type technologies like TOPCon and HJT push this even further but at a higher price point.
Request Independent Lab Validation
Do not rely solely on manufacturer-provided data. Ask if the product has been tested by an accredited third-party lab such as TUV Rheinland 6, Bureau Veritas, or Fraunhofer ISE. At our facility, we maintain updated TUV test certificates specifically because European buyers need that trust layer. If a supplier cannot provide independent validation, that is a red flag.
Check Positive Power Tolerance
A shingle rated at 80W with a +5W/-0W tolerance means every unit delivers at least 80W and potentially up to 85W. Positive-only tolerance ensures you never get less than what you paid for. This matters more in low-light regions where every watt counts.
What specific TUV or CE test data should I request to ensure performance on overcast days?
Our quality assurance team spends weeks preparing certification packages for every batch heading to Europe, because we know that without the right paperwork, your containers sit at customs and your projects stall.
Request IEC 61215 certification with low-irradiance test results, IEC 61730 safety certification, CE marking with a full Declaration of Performance under the Construction Products Regulation (CPR), and TUV-verified temperature coefficient and degradation rate data to confirm reliable output during overcast European conditions.

The Two Pillars: IEC 61215 and IEC 61730
IEC 61215 is the performance standard. It covers thermal cycling, humidity-freeze, damp heat, mechanical load, and — crucially — low-irradiance testing. Section 10.7 specifically evaluates how the module performs at 200 W/m². If your supplier's TUV report does not include this section, ask for it explicitly.
IEC 61730 is the safety standard. It covers electrical insulation, fire resistance, and mechanical integrity. Both certifications together form the baseline for CE marking.
CE Marking and CPR Compliance
For BIPV products entering Europe, CE marking alone is not enough. Solar roof shingles are simultaneously electrical devices and building materials. This means they must also comply with the Construction Products Regulation (CPR) 7. Ask for:
- Fire classification report (typically Broof(t1) for roof-mounted products)
- Wind load test results (critical for coastal regions)
- Water penetration test data (essential for shingles replacing traditional roofing)
| Certification / Test | What It Covers | Why It Matters for Overcast Regions |
|---|---|---|
| IEC 61215 (Section 10.7) | Low-irradiance performance at 200 W/m² | Directly confirms cloudy-day output |
| IEC 61730 | Electrical safety and mechanical integrity | Ensures safe operation in damp, cold conditions |
| CE + CPR Declaration of Performance | Fire, wind load, water penetration | Mandatory for building-integrated products in EU |
| Temperature Coefficient (TUV-verified) | Power loss per °C above 25°C | Low coefficients (-0.3%/°C) favor cool European winters |
| PID Resistance Test | Potential Induced Degradation under humidity | Prevents hidden power loss in damp climates |
| Degradation Rate Certificate | Annual power loss over time | Confirms <0.5%/year for 25-year warranty viability |
Temperature Coefficient: Your Winter Advantage
Here is something many buyers overlook. Solar cells lose efficiency as they heat up. The temperature coefficient tells you how much. A PERC shingle with -0.30%/°C loses only 0.30% of power for every degree above 25°C. In the cool, overcast winters of northern Europe, cell temperatures often stay below 25°C. This means your shingles can actually exceed their STC-rated output on cold, bright days. Ask for TUV-verified temperature coefficient data — not just the manufacturer's claim.
PID and Humidity Resistance
Potential Induced Degradation (PID) 8 is a silent killer in humid climates. High moisture levels combined with system voltage can cause ion migration within the cells, gradually destroying performance. Europe's damp winters make PID resistance testing non-negotiable. We include PID resistance in every batch certification because we have seen competitors' products lose 10–20% output within three years in coastal installations.
Degradation Rate: The Long Game
A certified degradation rate below 0.5% per year means your shingles will still produce over 87% of their original output after 25 years. This number must appear in the TUV report. Without it, any 25-year warranty is just words on paper.
Will my solar roof shingles maintain a stable power output during the long, gray winters in Europe?
When we first started exporting to Scandinavia and northern France over a decade ago, our R&D team obsessively tracked winter performance data from pilot installations — and the results were more encouraging than most people expect.
Solar roof shingles will produce reduced but stable output during European winters, typically generating 10–25% of peak rated power on overcast days. Cooler temperatures actually boost cell efficiency, partially compensating for lower irradiance. With proper system design including optimizers and battery storage, winter energy harvest remains meaningful and predictable.

Understanding Diffuse Light
On a cloudy day, sunlight still reaches your roof — it is just scattered by clouds and atmosphere. This is called diffuse irradiance 9. In northern Europe during winter, diffuse light can account for 60–80% of total available solar radiation. Modern monocrystalline PERC cells are engineered to capture this scattered light. They do not need direct beam sunlight to generate power.
A typical overcast day in London or Paris delivers 100–300 W/m² of irradiance. A well-designed solar shingle system rated at 8 kWp might produce 15–25 kWh on such a day. That is not zero. That is enough to run a heat pump, charge an EV overnight, or feed back into the grid under a net metering agreement.
The Cold Weather Bonus
This is the part most people miss. Solar cells are semiconductors. They perform better when cool. A shingle with a temperature coefficient of -0.30%/°C will produce approximately 3% more power at 15°C than at 25°C. During a cold, bright winter morning — which happens regularly even in overcast regions — your system can actually outperform its rated STC power. Our field data from installations in northern France confirms this consistently.
Seasonal Output Expectations
| Season | Typical Irradiance (Northern Europe) | Expected Output (% of Peak) | Key Factor |
|---|---|---|---|
| Summer (Jun–Aug) | 600–900 W/m² | 70–90% | Long days, high sun angle |
| Spring/Autumn (Mar–May, Sep–Nov) | 300–600 W/m² | 40–65% | Moderate diffuse light |
| Winter (Dec–Feb) | 100–300 W/m² | 10–25% | Short days, high diffuse ratio |
| Cold Bright Day (Winter) | 400–700 W/m² | 50–80% | Temperature bonus kicks in |
System Design for Winter Optimization
To maximize winter output, focus on three design elements:
Roof pitch. A steeper pitch of 40–45° captures more low-angle winter sun. In northern Europe, the sun sits low on the horizon from November through February. A 30° roof loses winter capture compared to 40–45°.
Microinverters or power optimizers. In winter, partial shading from chimneys, dormers, and neighboring buildings becomes more severe due to long shadows. Traditional string inverters shut down the entire string when one shingle is shaded. Microinverters isolate each shingle, so shading on one unit does not kill the output of the others.
Battery storage. Winter days are short. Peak production happens in a narrow 4–6 hour window. A battery stores midday generation for evening use, dramatically improving self-consumption rates.
Real-World Winter Data
From our monitoring systems on installations in Lille, France, a 6.5 kWp solar shingle roof produced an average of 8.2 kWh/day in December 2024 and 12.4 kWh/day in February 2025. These numbers will not match July's 32 kWh/day, but they cover 35–40% of a typical household's winter electricity demand. Combined with a 10 kWh battery and smart tariff management, the system reduced the homeowner's grid dependency by over 55% annually.
The takeaway: winter output is lower, not absent. And the economics still work when you account for the full 12-month cycle.
How do I evaluate the ROI of high-efficiency BIPV tiles compared to standard panels in low-irradiance regions?
In our conversations with roofing companies and distributors across Europe, the ROI question always comes down to one thing: total cost of ownership over 25 years, not just the upfront price tag.
Evaluate BIPV tile ROI in low-irradiance regions by calculating the dual savings — replacement roofing cost plus energy generation — then comparing levelized cost of energy (LCOE) against standard panels using site-specific PVGIS yield data, factoring in installation labor savings, aesthetic value uplift, available subsidies, and the 25-year degradation trajectory.

The Dual-Value Proposition
Standard rack-mounted panels sit on top of an existing roof. BIPV solar shingles replace the roof. This means you must subtract the cost of conventional roofing materials (slate, clay tiles, or premium shingles) from the BIPV price to get the true solar premium. For many European projects, this dual function cuts the effective solar cost by 30–50%.
For example, if a high-quality slate roof costs €80/m² and a solar shingle system costs €180/m², your actual solar premium is €100/m² — not €180/m². Standard panels at €120/m² still need the €80/m² roof underneath, totaling €200/m². Suddenly, BIPV is cheaper.
LCOE Calculation for Low-Irradiance Sites
Levelized Cost of Energy (LCOE) 10 divides total system lifetime cost by total lifetime energy production. It is the single best metric for comparing solar investments across different climates.
Here is a simplified comparison for a typical 8 kWp system in northern France (annual irradiance ~1,100 kWh/m²):
| Factor | BIPV Solar Shingles | Standard Roof + Panels |
|---|---|---|
| Roof material cost | Included (€0 extra) | €6,400 (80m² × €80) |
| Solar system cost | €14,400 (80m² × €180) | €9,600 (€120/m² × 80m²) |
| Total installed cost | €14,400 | €16,000 |
| Annual yield (PVGIS est.) | 7,500 kWh | 8,200 kWh |
| 25-year total yield | ~175,000 kWh | ~192,000 kWh |
| LCOE | €0.082/kWh | €0.083/kWh |
| Aesthetic premium | High (seamless integration) | Low (rack-mounted) |
| Roof warranty | 25 years (single system) | Split (10yr roof + 25yr panel) |
The numbers are closer than most people assume. And this does not yet account for two important advantages of BIPV: higher property value and single-warranty simplicity.
Full-Roof Coverage Advantage
Standard panels leave gaps — around vents, dormers, and edges. Solar shingles cover the entire roof surface, including complex geometries, hips, and valleys. On a multi-gabled European home, this means 20–40% more active solar area compared to standard panels. In low-irradiance regions, more active area directly compensates for reduced per-square-meter output.
Subsidy and Incentive Stacking
Most European countries offer incentives for BIPV specifically, not just generic solar. France's MaPrimeRénov' program, Germany's KfW loans, and the UK's Smart Export Guarantee all provide financial support. Some programs offer enhanced rates for building-integrated systems. Check your local incentive database — the savings can shorten payback by 2–5 years.
Payback Period Reality
In southern France with 1,400 kWh/m² annual irradiance, payback on a BIPV shingle roof runs 8–12 years. In northern France or southern England with 1,000–1,100 kWh/m², expect 12–16 years. This sounds long, but remember: the roof itself has a 40–50 year lifespan, and the shingles keep producing energy for 25+ years. After payback, every kilowatt-hour is profit.
We always advise our partners to present ROI calculations to their end customers using the full dual-value model. When you show a homeowner that they are getting a new roof AND a power plant, the value proposition shifts dramatically.
The Battery Multiplier
Adding a 10–15 kWh battery to a BIPV system in an overcast region typically improves self-consumption from 30% to 65–75%. At European electricity prices of €0.25–0.40/kWh, this self-consumed energy is worth far more than grid export credits. For an 8 kWp system producing 7,500 kWh/year, increasing self-consumption from 30% to 70% adds €750–1,200 in annual savings. The battery pays for itself in 5–7 years.
Conclusion
Evaluating solar shingle low-light performance requires data, not guesswork. Request certified test results, simulate yields with PVGIS, and always calculate ROI using the full dual-value model.
Footnotes
1. Explains how PERC technology enhances efficiency and performance in low-light conditions. ↩︎
2. Official standard for design qualification and type approval of terrestrial PV modules. ↩︎
3. Defines the industry standard conditions for testing and comparing solar panel performance. ↩︎
4. Standard addressing safety aspects of solar panels, including electrical, mechanical, thermal, and fire safety. ↩︎
5. Official European Commission tool for calculating solar energy production potential. ↩︎
6. Leading global provider of testing, inspection, and certification services for PV modules. ↩︎
7. Explains the regulation for BIPV products as construction materials in the European Union. ↩︎
8. Explains the phenomenon of potential-induced performance degradation in PV modules. ↩︎
9. Defines scattered sunlight that reaches the Earth’s surface indirectly, crucial for cloudy days. ↩︎
10. Metric for comparing solar investments by dividing total lifetime cost by total lifetime energy production. ↩︎